ZF CUTS POWER CONSUMPTION IN PRODUCTION PLANTS
Project location
All locations with significant energy consumption


Year of implementation
2019-2024
Application
Energy Monitoring Solution


Hardware
UMG 512-PRO, UMG 96-PA, UMG 801, UMG 806


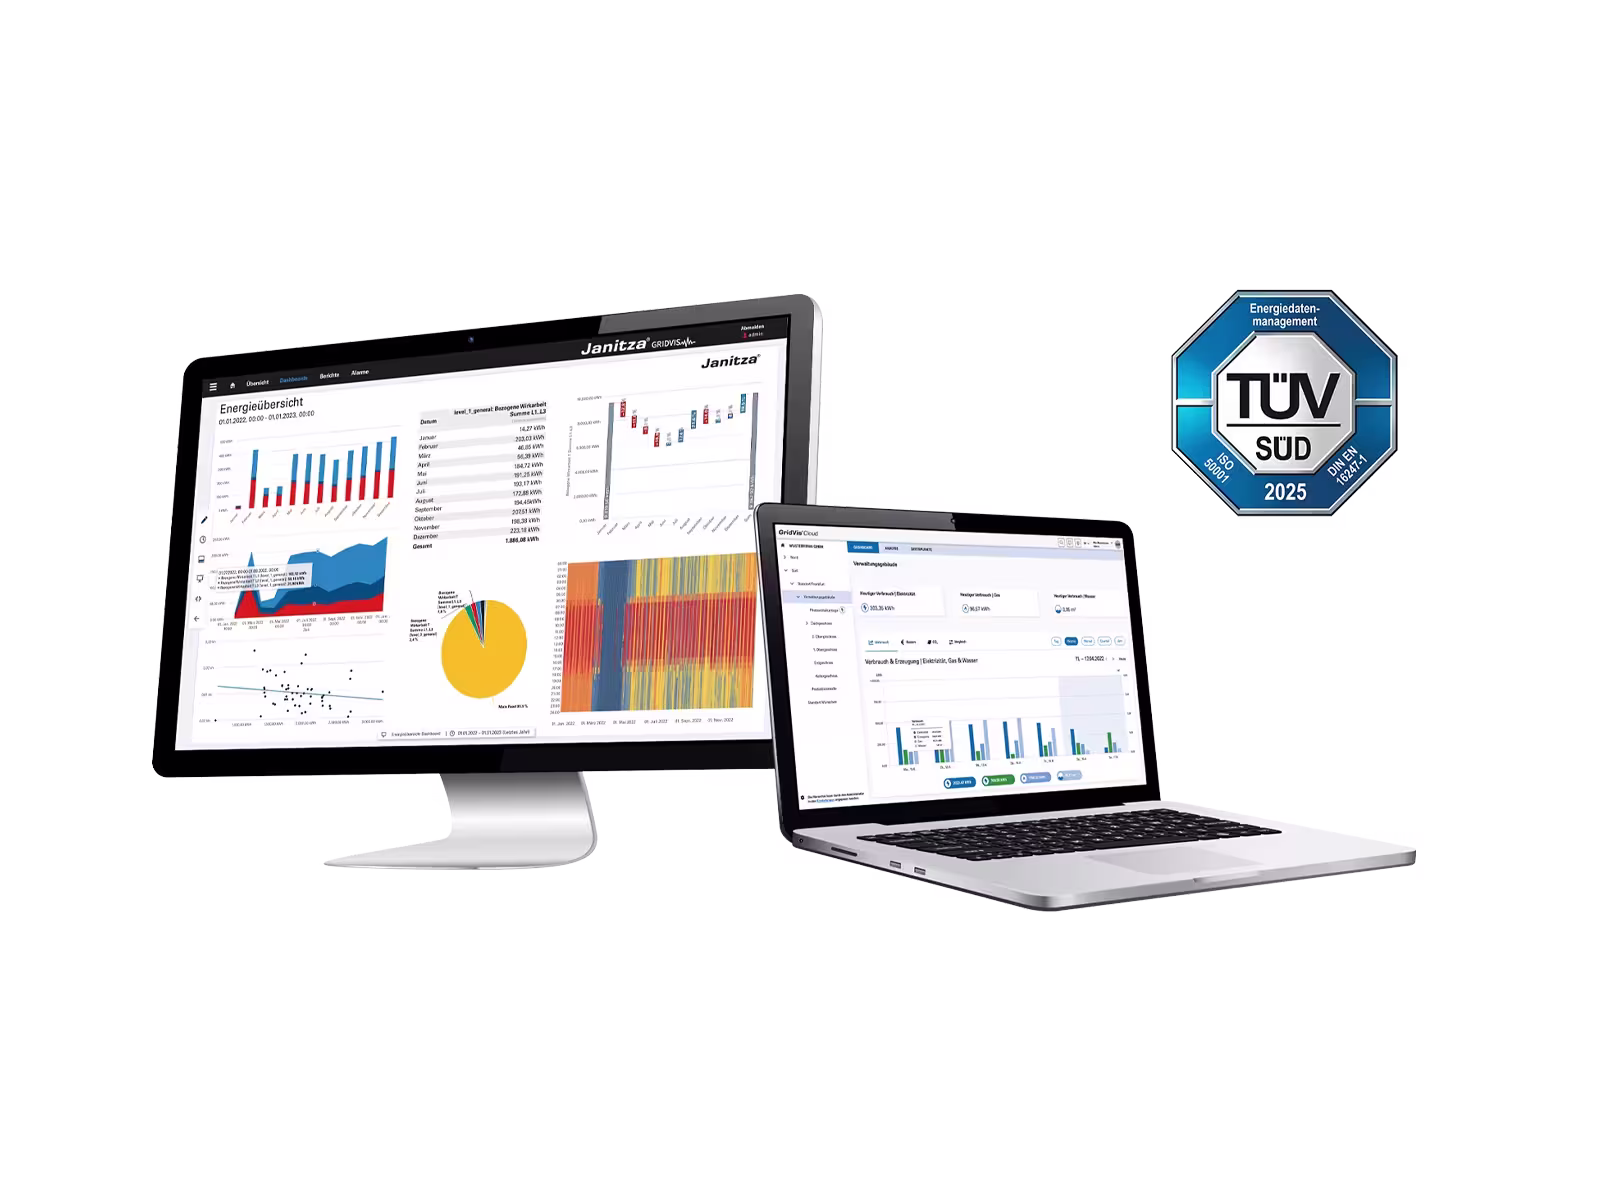
Software
GridVis®
Service
Project planning, Delivery of hard- and software, Project based installation (on request), Project commissioning, Service support and training


REQUIREMENT
With 161 production sites in 30 countries and approximately 161,600 employees worldwide, ZF is one of the world’s leading automotive suppliers. The company is committed to continuously improving the energy efficiency of its global production facilities. Sustainability is a core element of ZF’s strategy, which includes the ambitious goal of achieving complete climate neutrality by 2040. To reduce environmental impact, conserve resources, and drive performance through efficient energy use, ZF has implemented a group-wide energy management system in accordance with ISO 50001. Previously, a lack of detailed data on energy consumption made it difficult to effectively track the company’s sustainability initiatives and targets. Those responsible were unable to monitor progress toward goals related to the consumption of electricity, gas, compressed air, and water. Most of the available data came from monthly utility bills, often received up to two months after actual consumption—too late to take timely corrective action. ZF had no access to detailed, real-time data from its production plants.
SOLUTION
With Janitza as partner, a real-time data analysis was setup using an ISO 50001-compliant energy management solution to monitor energy distribution across levels 1 to 3 within the plants. At Level 1 (transformer stations), the UMG 512-PRO monitors energy flows and voltage quality at the grid feedin point. At Level 2 (distribution), the UMG 96-PA is used as a standard device for monitoring individual outgoing feeders, while the UMG 801 handles multiple feeders. At Level 3 (machine level), the UMG 806 monitors individual or grouped machines, supplemented by other measuring devices depending on the application. GridVis® grid visualization software is used across all facilities to monitor key performance indicators and energy consumption in real time.


BENEFIT
The implementation of a real-time monitoring strategy enabled ZF to significantly reduce energy costs while generating valuable data to support its sustainability objectives. By using a load management system, energy consumption at the plants was reduced by up to 15%, empowering ZF to pursue even more ambitious goals—such as measuring the carbon footprint at the product level. Janitza’s GridVis® software supports this development and will play a key role in the company’s future growth, including the planned rollout of a cloud-based Digital Manufacturing Platform (DMP) across its production sites. This also contributes significantly to compliance with the Corporate Sustainability Reporting Directive (CSRD).