FROM ENERGY DATA COLLECTION TO REGRESSION ANALYSIS

Project location
Nürnberg, Germany

Year of implementation
2023

Application
Power quality and energy analysis

Hardware
UMG 512-PRO, UMG 509-PRO

Software
GridVis® Expert

Service
Replacement of existing devices

REQUIREMENT
Veltins is one of the largest German breweries. Accurate operating data is essential for the continuous expansion and modernization of the production facilities, especially in times of rising energy costs. To this end, the pulse inputs of the meters were initially fed to the production data acquisition system via PLC. This procedure was to be replaced by direct recording based on measurement devices with suitable interfaces. The requirements of the departments are diverse. While the electrical workshop is mainly concerned with safety, capacity planning and power quality parameters, the process control technology focuses on energy management and ISO 50001 certification.
SOLUTION
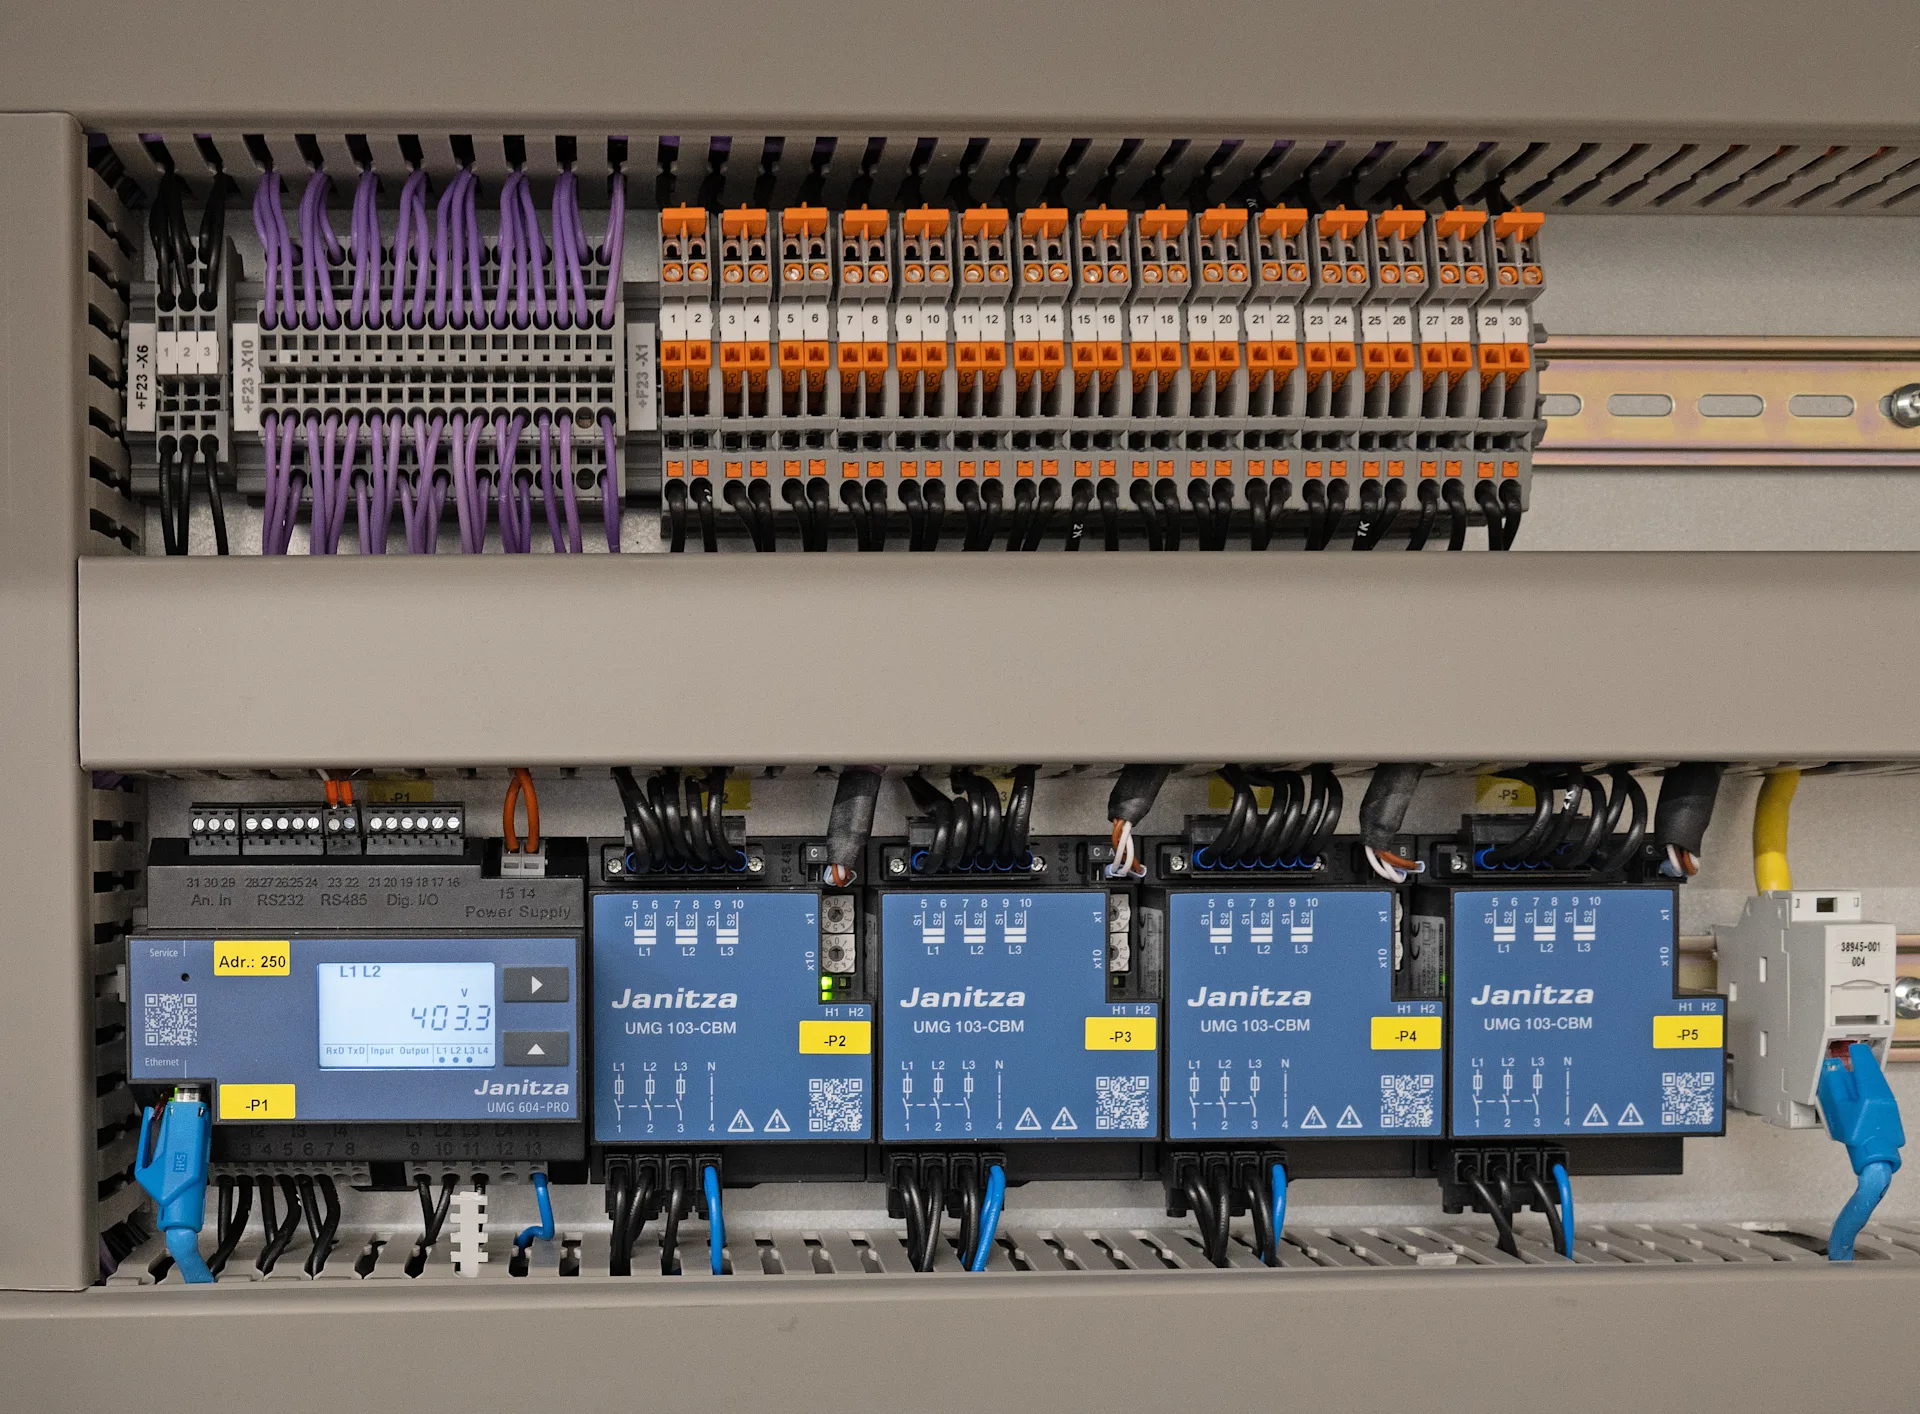
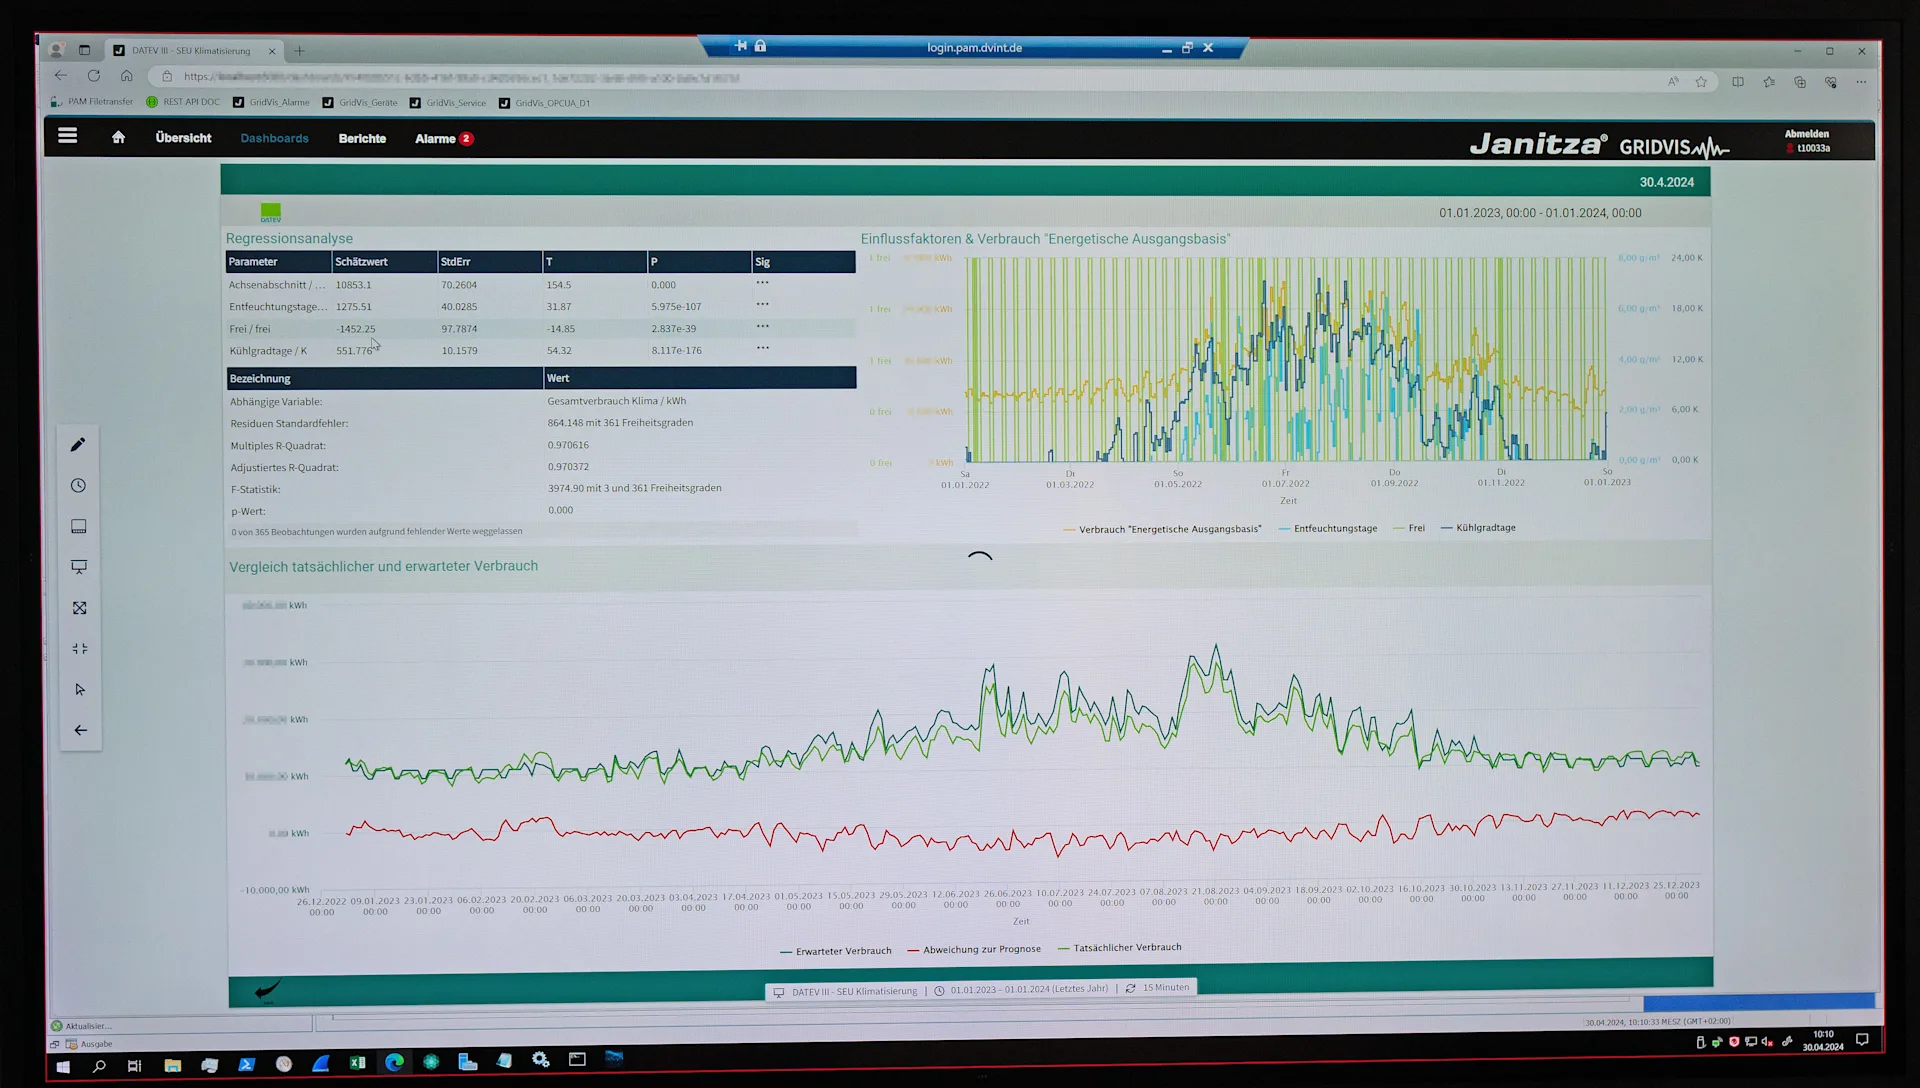
IIn 2009, DATEV conducted a trial run with a UMG 604 power analyzer in combination with a UMG 103 energy analyzer. Updates are even available for the UMG 604. Impressed by the quality, DATEV has been installing only Janitza devices in new systems for several years now. In 2023, the company decided to replace its existing devices as well. Once this measure has been completed, around 700 Janitza devices will be in service at the Nuremberg headquarters alone. UMG 509-PRO and UMG 512-PRO power qualitiy analyzers are installed at the outputs of the transformers and UPS systems. The data is analyzed and evaluated using the power grid monitoring software GridVis®. It provides an overview of the transformers and UPS systems with load profile, utilization, efficiency, and power loss. Operators can also view different time periods via a dashboard. Devices from other manufacturers can also be integrated – all that is required is an open interface. In the data center, this option is used to record both the electrical power consumption of the IT systems and the cooling capacities. The connection is made via BACnet to a multi-protocol server, which forwards the data to GridVis® via OPC UA. The software also performs regression analysis, which takes external influences such as working hours and weather conditions into account. This is the only way to evaluate energy efficiency measures in a meaningful way.

BENEFIT
Thanks to regression analysis with GridVis®, it is possible not only to evaluate energy efficiency measures, but also to make approximate predictions for the load profile. With the editor, users can quickly create, copy, and customize dashboards. They can also create templates that can be easily adapted to individual locations. DATEV also uses the results internally. In data centers, it is particularly difficult to find the right balance between reliability and energy efficiency. With Janitza's measurement technology and power grid monitoring software, even very complex processes can be clearly displayed, possible scenarios can be played out, and data can be prepared in such a way that it facilitates decision-making for operations and investments.


