Highlights
The highlight of GridVis® 9 is the new improved dashboard editor. Numerous visualization objects and the intuitive operation open up completely new possibilities for the individual design of your dashboards.
Clear and customized Dashboards
The Dashboard Editor for the Standard and Expert editions allows for the customizable design of dashboards. Save time and effort when creating your documents with the intuitive tools and drag-and-drop system. Customizable measured values and templates help you to have an overview of the most important values. With the new dashboard period and customizable time periods for each object, you can quickly and easily compare the values from different time periods.
Individual dashboards can also be released for people without a GridVis® login. This means that you can release selected dashboards for viewing by others or for example for integration on public displays or the intranet.

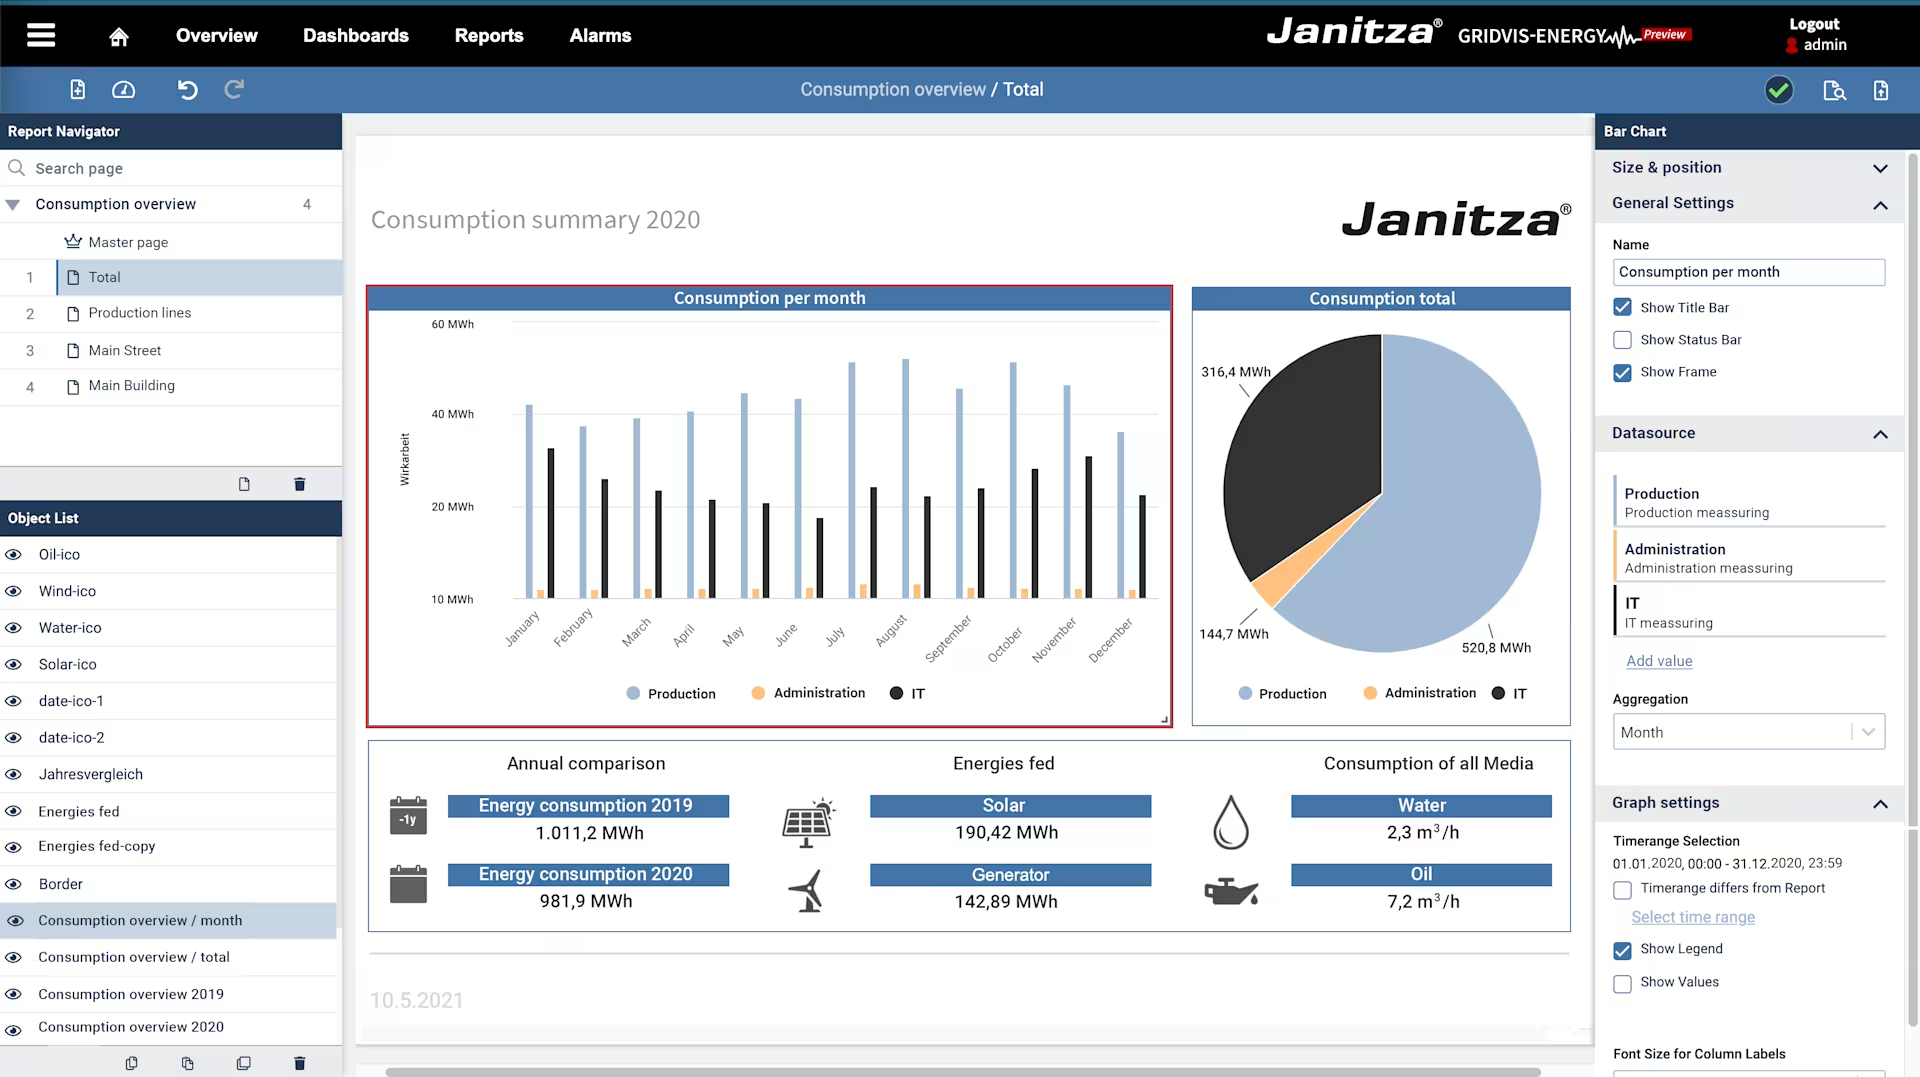
Customize Reports
The GridVis® Expert Report Editor enables you to customize reports, archive them and make them available as PDFs in compliance with standards. Additionally, they can be sent automatically via email. Embed images and logos and use various objects, such as charts, in the design of your reports. Reports such as the meter reading cycle and utilization reports are now also available in the web application.