Use in facility management
GridVis® power grid monitoring software is a powerful solution that helps your facility infrastructure become more efficient and sustainable.
GridVis® creates transparency and provides more detailed insights into your energy data. This helps you evaluate the carbon emissions of your facility and detect unnecessary consumption. In addition, this software makes it possible to evaluate energy costs for various consumables, e.g. gas, water or heat. In addition, it also provides the option of clearly displaying and evaluating energy costs for customers and tenants.
With GridVis®, you can optimize facility management whilst also reducing your operational costs and carbon emissions.
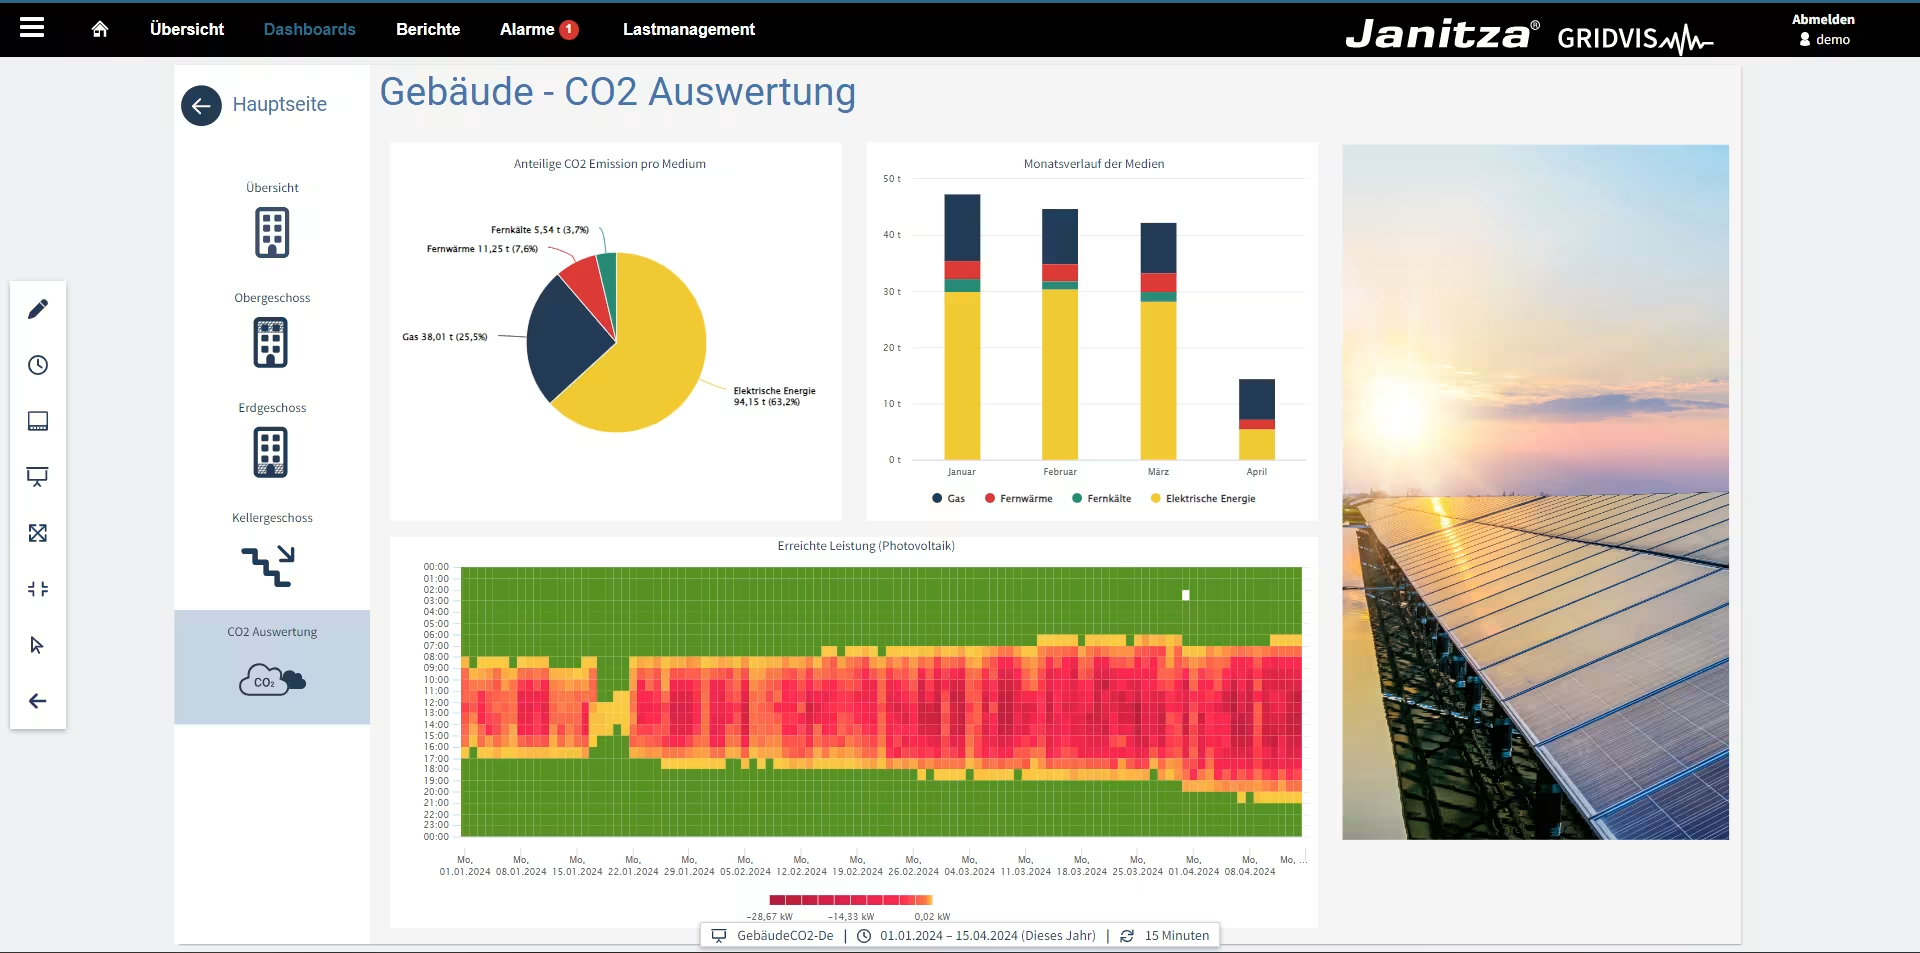
Carbon emissions
Recording the carbon emissions of buildings has become indispensable at this point due to legal requirements, rising energy costs and the interests of customers and tenants. This goes hand-in-hand with the measurement of waste heat and energy consumption.
GridVis® helps you efficiently record, monitor and document carbon emissions, waste heat and energy consumption.
Making carbon emissions, waste heat and energy consumption visible
Recording carbon emissions, waste heat and energy consumption in buildings is an increasingly common obligation. GridVis® helps handle your obligations by making such consumption, carbon emissions and other data visible whilst documenting it.
Prepare analysis of consumption, costs and carbon emissions and have your values displayed by media or as a total value. Store contracts to convert all your consumption values directly into carbon emissions and use virtual devices to create key figures for evaluation.
- Store contracts and easily convert consumption values into carbon emissions
- Overview of energy costs
- Media-related views
- Generating key performance indicators with the KPI editor and status visualization
- Carbon emission analysis as well as analysis of consumption and costs
- Creation and calculation of cost centers

You can prepare your data visually using ready-made or customizable dashboards. Diagrams and various objects help you quickly record and interpret your values at a glance. Customized reports can be created and sent automatically. You can also implement a plausibility check with Sankey diagrams and VDs.
- Standardized and individually customizable dashboards
- Energy and carbon emission values can be accessed at any time
- Easy interpretation of measurement data thanks to graphical processing and comparison options
- Flexible reports editor for customized reports
- Enable reports to be automatically created and send for ease of documentation
- Sankey diagrams and virtual devices for simple plausibility checks
Integration of measurement devices
GridVis® simplifies the complicated process behind evaluating carbon emissions. Data imports and inclusion of meters via Modbus enable integration of all energy sources & auxiliary materials (e.g. gas, water and heat) into the software. This enables you to see and evaluate all data in one item of software.
- All carbon emissions in one item of software at a glance
- Includes all important energy sources and auxiliary materials
- Simple integration of third-party meters via Modbus
- Quick to configure with little effort thanks to contract management with standard conversion factors
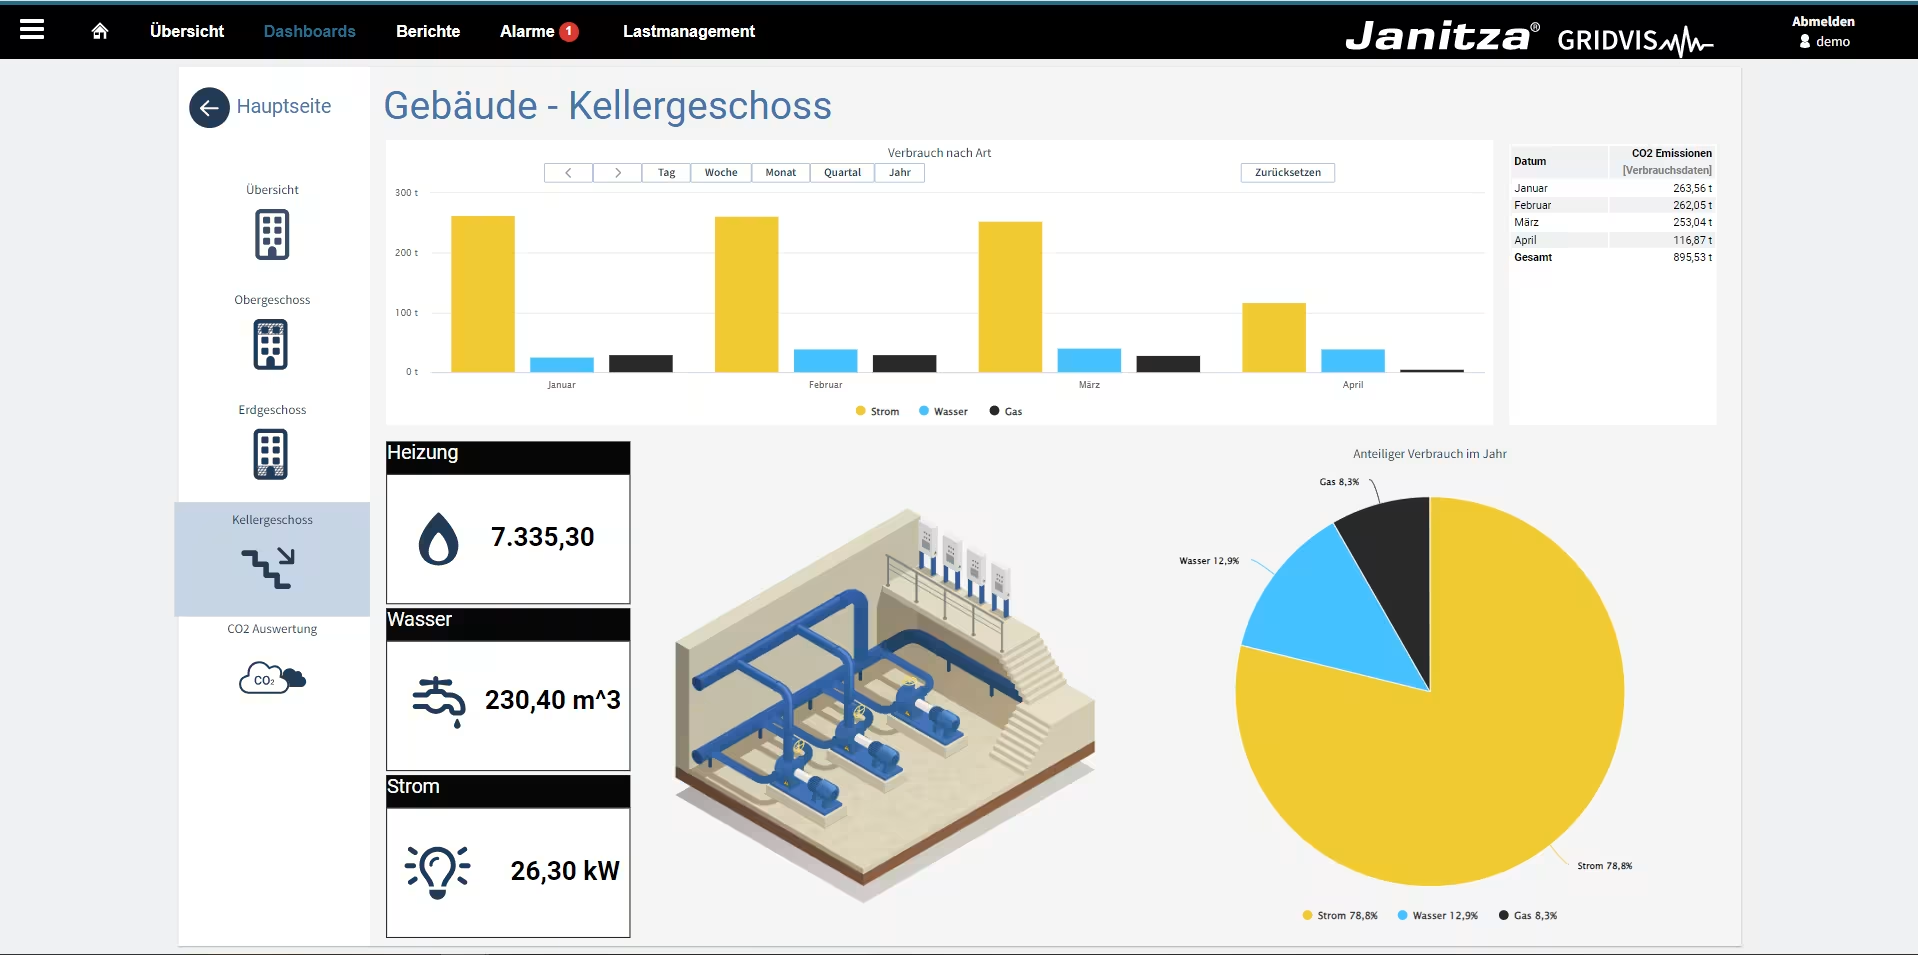
Analyze consumption
To prevent unnecessary costs, avoidable consumption must be detected quickly and reliably. GridVis® helps you to record, clearly display and document the energy consumption of all energy sources in one software package. These clear insights enable building managers to quickly identify potential waste and take targeted measures to reduce consumption.
All energy sources
Data imports and inclusion of meters via Modbus enable integration of all energy sources & auxiliary materials into the software. This enables you to see and evaluate all data in one item of software.
- All data in one item of software
- Integration of all energy sources and auxiliary materials e.g. water, gas, heat
- Simple integration of third-party meters via Modbus
- Quick to configure with little effort thanks to contract management with standard conversion factors

Simple data preparation
You can prepare your data via prepared and customized dashboards. Diagrams and various objects, such as Sankey diagrams, help you quickly record and interpret your values at a glance. You can then trace your energy flows and discover avoidable consumption.
- Standardized and individually customizable dashboards
- Simple allocation of measured data thanks to graphical preparation and options for comparison
- Intuitive and user-friendly to operate
- Overview of energy flows in the form of Sankey diagrams
Automated documentation
GridVis® enables secure, automated documentation of your data. Standardized and customized reports data exports provide an overview whilst assisting with documentation and evaluation of your data.
- Secure storage for your data
- Simple documentation with standardized reports
- Customized reports as PDF with a flexible report editor
- Intuitive and user-friendly to operate with drag & drop
- Inclusion of in-house logos and images
- Automatic reporting and dispatch for seamless documentation
Alarms in the event of unusual consumption patterns
With GridVis® you can set simple limit values for your data. If these limit values are exceeded then an alarm can be automatically issued! You can then note immediately if unusual consumption patterns emerge and can take countermeasures against them.
- Monitoring realtime data
- Set individual limit values
- Automatic alarms when limit values are exceeded, e.g. via email
Energy costs
GridVis® makes it possible to see all energy-related costs at a glance. They provide a comprehensive overview of energy consumption across various periods, making comparisons easier. GridVis® means you don’t just have full control of your energy costs, but you are also able to make informed decisions on how to improve energy efficiency and therefore reduce costs.
Energy-related costs
Your energy-related costs can be easily displayed in the GridVis®. Store contracts and conversion factors, and GridVis® displays all costs based on consumption.
- Easily store contracts and conversion factors
- Cost development in charts for all media
- Media-related display as well as options to show and hide individual media
- Display and evaluate total values of all media
Evaluate & compare consumption
GridVis® provides various evaluation options for your energy data. Analyze measured values and KPIs. Dashboards and automated reports enable evaluation of costs and consumption to be quickly recorded.
- Energy costs and consumption over various periods of time can be readily compared with each other
- Analyze and evaluate KPIs
- Individually customizable dashboards for an overview that is easy to understand
- Automated reports for documentation and evaluation
- Secure storage for your data
Individual evaluation options
GridVis® makes it possible to differentiate when it comes to consumption data, such as between different tenants and customers. The data can be shown individually for every single party whilst being simple to prepare and document.
Differentiation of energy and consumption data
Create customized dashboards and reports for individual parties. In GridVis® all measurement points and consumption values can be individually assigned to this effect and, for example, also be summarized via virtual devices to provide a quick and simple overview. This also makes the plausibility check for the supplier’s bill easier.
- Create customized dashboards and reports for each party
- Calculate and summarize measurement points and consumption data
- Simple allocation of the individual measurement points
- Plausibility check for the supplier’s bill
- Simple access to the data via a standard web browser
Transparency for customers and tenants
GridVis® helps you provide transparency for your customers and tenants. Automatically issued reports means that all parties are aware of consumption and costs at all times.
- Individually customizable reports
- Numerous graphical objects for clear preparation of data
- Automated dispatch of reports, e.g. once per month
- Integration of all energy sources and media (e.g. water, gas, heat)
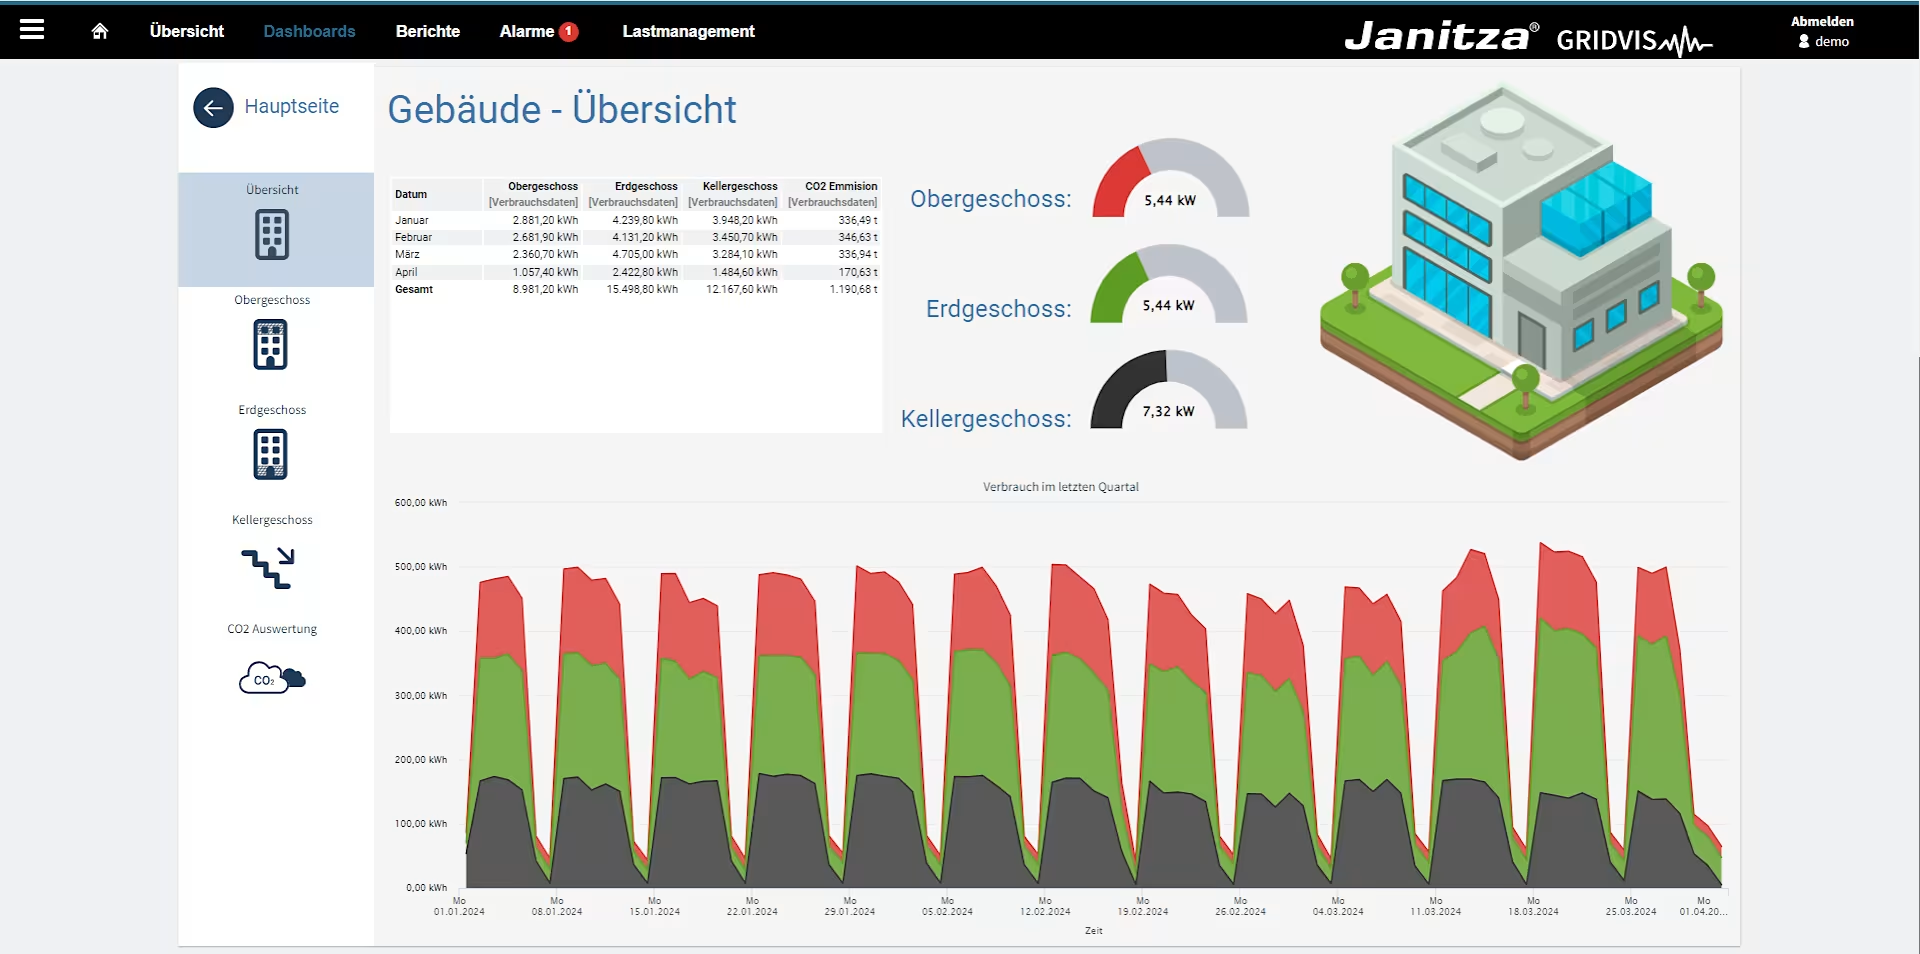
Transparency
Obtain a fast, simple overview of all relevant data - both customized and regardless of the manufacturer. GridVis® also enables the storage and evaluation of digital signals, such as when opening doors.
Use all energy data
GridVis® enables you to use all desired energy sources & auxiliary materials in a single piece of software. Both meters and external measurement devices can be readily integrated via Modbus. The recorded data can be clearly displayed, e.g. split up according to buildings, rooms or media, depending on what is required. Clear and individually customizable dashboards and reports enable simple, clear illustration of all data and values.
- All energy sources and auxiliary materials (e.g. electricity, water, gas, heat, etc.)
- Contract management with standard conversion factors for quick configuration with little effort
- Integration of external measurement devices and meters via Modbus.
- Data imports for simple integration of additional data
- Media-related displays such as for energy costs or consumption values
- Overview on dashboards and in reports

Logging states
GridVis® also provides the option of logging and documenting various states. For example, this could provide an overview of door openings or temperatures.
- Capture, visualize and document digital signals
- Analyze and evaluate temperatures
- Simple integration of temperature measurements via Janitza meters
- Maintain insight into processes within the building (e.g. entrances)