
Energy monitoring made easy
Quick and easy access to the energy monitoring portal
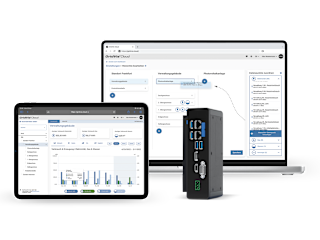
No matter whether verifications need to be provided, electricity savings are required or the CO2 balance must be calculated, the GridVis® Cloud helps to accomplish these tasks. As a software service, it offers an energy monitoring tool that can be integrated into your daily work routine with very little effort.
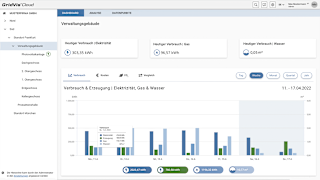
Upload measurement data to the Cloud, and then access these data anytime, anywhere on the dashboard. The start page provides a quick overview, and standardized graphical presentations and charts ensure uncomplicated evaluation.
Information such as rate agreements and emissions can be integrated for subsequent automatic evaluation.
Core functions

Visualization
Recognize savings potentials and weak points using data visualization

Evaluation
Check and evaluate energy consumption and extreme values which have occurred

Overview
Interactive dashboards for a quick and comprehensive overview


Comparison
Comparisons of energy consumption over time periods, locations and consumption media

Setup
Convenient device integration and easy setup
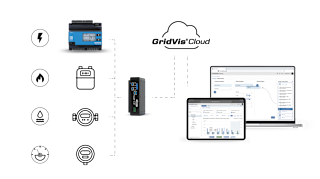
System architecture

System functions
Web-based access
- With standard browser on PC/ laptop
- Display optimized for tablets
- Access via Internet without VPN
Availability (24-hour operation)
- Software-as-a-Service as a web application
- Measurement data storage on European servers
User management
- User management via Janitza ID
Alarm management
- Monitoring of device communication
Supported media
- Electricity
- Gas
- Water
Key performance indicators & logic
- Measurement points (hierarchical)
- Automated summation (consumption)
Automation
- Automatic readout of energy consumption data
- Time synchronization via the application (alternative for NTP)
Sending emails
- Email service in the GridVis Cloud
- Send exports and reports by e-mail
Software-based recording of measured values
- Online recorder for measured value recording
- Janitza measurement devices without measured value memory
- Third party products (Modbus TCP/RTU)
Visualization
Dashboards
Predefined dashboards (display filtered to one measurement point)
List Function
- Hierarchy (project structure with levels)
- Device overview
- Search and filter function
Energy and measured value analysis
- Graph function on the web
- Aggregation function
- Comparison periods
Connectivity
Data import
Manual data entry
External devices
Integrate third-party devices via Modbus
Article numbers
Basic package 5 Items
5100801
Basic package 10 Items
5100802
Basic package 25 Items
5100803
Basic package 50 Items
5100804
Basic package 100 Items
5100805
Licensing
The Cloud can be licensed in different sizes, so it remains scalable and you only pay for the items you really need.
Item packages
Your item packages determine how many items are available to you in the GridVis® Cloud. You need to consider how many items – users and measurement devices – you need for your project and then select an appropriate item package. The packages can be combined and supplemented later on as desired. That means the GridVis® Cloud can grow along with your requirements.
5 Items
10 Items
25 Items
0 Items
0 Items
What are items?
Items are virtual units used to determine the size of the required GridVis® Cloud. An item represents a measurement device integrated or created in the cloud, or a created user, i.e. persons who are given access to the Cloud.
Calculation example
This is how the required items are calculated
Integrated measurement devices | 7 |
Manually created measurement devices | 2 |
Water meters (via Modbus) | 2 |
Users via Janitza ID | 3 |
Total items | 14 |
Item packages required | 10 + 5 = 15 |
Items still available | 1 |
Extension
If the period of use expires, the GridVis® Cloud can no longer be used.
So, extend your period of use in time by 1 or 3 years.
1 Year
Highlights
Gain insight into our highlights and what makes the GridVis® Cloud so special.
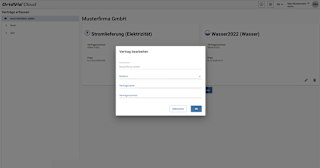

Costs and CO2 emissions
- Easily store contracts and conversion factors
- Automatic conversion when displaying the data
- Show costs incurred and CO2 emissions
- Cost development in charts for all media
- Conversion to a uniform consumption basis (if possible)
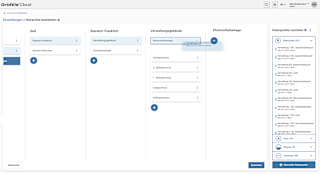

User friendly operation
- Drag & drop principle
- Build and map structures easily
- Automatic readout of connected measurement devices
- Intuitive management of offline measurement devices
- Central, automatically generated overview page
- A tile with the current daily consumption for each medium

Automated page and data preparation
- Filtered display depending on the selection of the viewing point
- Media-related display as well as the option to show and hide individual media
- Standard calculation of the sum of consumptions in subcategories
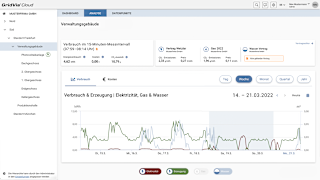
- Storage and display of the 15-minute consumption values
- Distinction between generated and consumed energy
- Presentation of generated energy in a chart

Analysis
- Flexible and detailed analysis with one click
- Not just a simple summary but the complete history
- "Current" consumption in the last 15-minute measuring interval
- Numerical consumption data
- Indication of measurement gaps
- Consumption and costs in a chart for the selected period as well as the possibility to switch to the cost view
- Quick, clear comparison with the previous period in a bar chart
- Individual time instant selection and fast time shift
Accessories
The Cloud Connector is the crucial link between hardware and software and enables simple and automated commissioning.
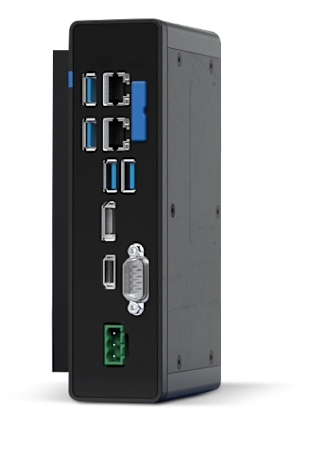

The Cloud Connector
- The Cloud Connector is the interface between your measurement devices and the GridVis® Cloud Portal. It ensures that on-site data are packaged and securely transferred to the Cloud, so you can access your information anytime, anywhere.Installation is quick and easy thanks to our presets. The Cloud Connector connects to the local network completely automatically and the Janitza Ethernet devices are also detected automatically.Connecting to the Cloud requires a one-time login to the Cloud via the Connector's web front end. After that, the connected devices and their status can be queried, and additional measurement devices can be integrated manually. The energy readings are then automatically transmitted to the Cloud cyclically, allowing them to be retrieved from there as needed.
Get personal advice now
Your request is important to us and we guarantee fast and professional processing.


