Measure, calculate, save – ring buffers are a thing of the past
As described in detail in the previous article, our latest-generation measurement devices offer very powerful signal processors (DSP), which enable continuous and seamless recording of current and voltage as well as the calculation of all conceivable parameters. How does this happen in detail, how does the measurement process work, in what form are measured values available and where are they stored?
Modern measurement devices such as our UMGs can basically be thought of as PCs. The main elements are CPU (DSP), RAM, hard disk (flash memory) and communication ports (RS485, RJ45).
A basic distinction is made between the following measured value types:
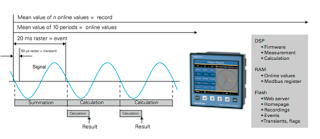
Online values
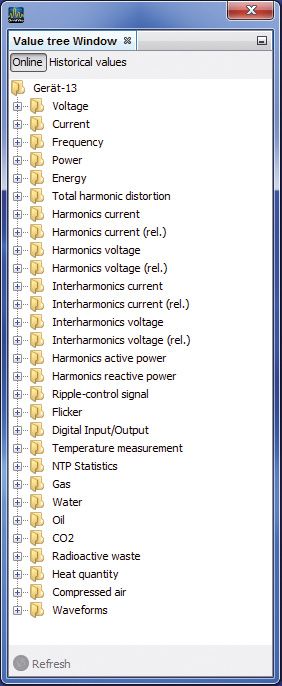
Online values are determined over a measurement interval of 200 ms or as an average of the full wave effective values of 10 periods. Online values are all values that the measurement device permanently determines and calculates. Depending on the measurement device, up to 2,000 values are available per 200 ms for all measuring channels. The most important ones can be read directly from the UMG display. GridVis® software and the topology views can be used to display the entire scope of the measured values.
All measured values are permanently available in defined Modbus memory registers for external access by suitable third-party software.

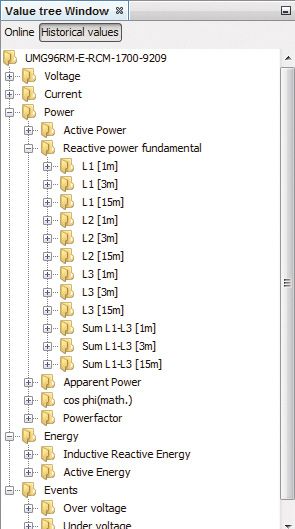
Historical values
Historical values are formed from the online values. To do this, one or more recording configurations are created in the device configuration. A period is defined for the respective record for forming an average value, e.g. 15-minute average values for recording load curves, 1-hour average values for energy, etc. Depending on the device type, the time periods can be between 200 ms and several days. Predefined recording configurations are available for power quality measurements in accordance with EN 50160, EN 61000-2-4 or EN 50160, IEEE519, and can be activated with a click.
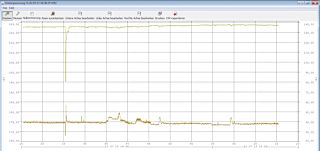
Historical values are usually first saved in the measurement device on an internal flash memory, formerly also known as a ring buffer. Each stored value is given a time stamp. The values are read out manually or automatically (service) using the GridVis® software. The measured value and time stamp are stored in a database. These values can then be analyzed in tabular or graphical form using GridVis® or external database tools.

Events
Events include overvoltages, undervoltages, and overcurrents. This is based on the 20 ms full-wave RMS values for the UMG 604 and UMG 508 and the 10 ms half-wave RMS values for the UMG 605 and UMG 511. If the defined tolerance limits are exceeded or not reached, the event is saved to the flash memory. In addition, a run-up and lag time period is defined so that the network activity can be analyzed directly before and after the event occurs. As a result, all voltage and current channels are displayed graphically and coherently over the specified evaluation period.

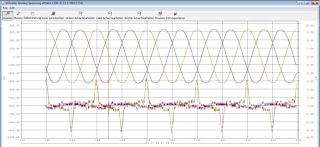
Transients
The full performance of the UMGs is required to record transients. At a sampling rate of 20 kHz, it is possible to record transients from 50 μs. As for recording events, threshold values as well as run-up and lag times can be defined. In the same way, you can specify which channels are recorded as waveforms at the same time as transients occur in a graph.

Flags
Flags are used to identify and store irregularities during measurement and recording in accordance with the IEC 61000-4-30 standard. For example, the causes of recording gaps can be identified.
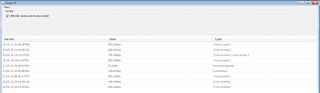

Flag | Note |
|---|---|
LostWindow | 200 ms measurement window has been lost |
LostPLL | The device has lost mains synchronization |
OverCurrent | Measuring range exceeded A |
OverVoltage | Measuring range exceeded V |
Firmware upgrade | Firmware upgrade |
Initialization | Initialization buffer |
All recordings of historical data, events, transients and flags run continuously, independently of each other and in parallel in the measurement device.
All saved data is stored in historical order. If the flash memory is full, the historically oldest data is overwritten. By regularly reading the data into a database, values that are overwritten on the measurement device are already stored on the server so that no measured values are lost.