Technical details
Item no.: see product variants


Drawings


Data at a glance
Certifications
- productCertifications.ul
- ANSI
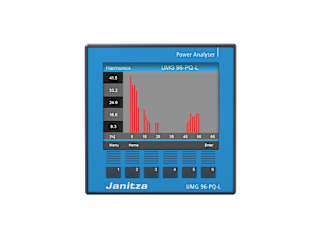
Harmonics V / A
1st – 65thActive energy class
0.2S (…/5 A)Digital inputs
3Digital / Pulse output
3Memory size
64 MBInterfaces
- RS485
- Ethernet
Protocols
- productProtocols.modbusRTU
- productProtocols.modbusTCPIP
- productProtocols.modbusGateway
Networks
- TT-Net
- TN-Net
Product variants
Functions and features
Power quality
- Harmonics current up to the 65th harmonic
- High sampling rate with 280 sampling points per full wave
- 1 ms digital input event capture rate
- 20 ms RMS value memory
- Full-wave events
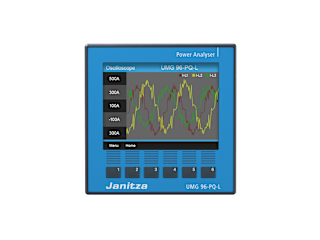
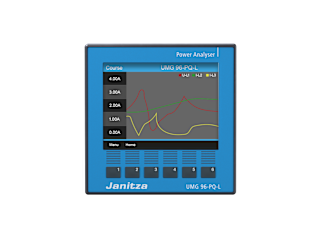
Visualization
- Función de osciloscopio
- Diagrama fasorial en la pantalla
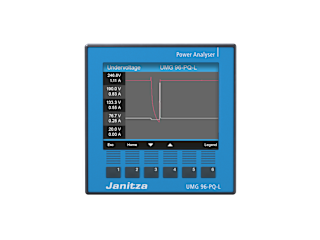
- Historia de los indicadores de seguimiento en la pantalla
- Restablecimiento de los indicadores de seguimiento a través de la pantalla o remotamente
Installation & Integration
- Overvoltage category 600 V CAT III
- Easy installation thanks to 96 x 96 mm front panel
- Use in IT networks with variants 52.36.005
- Time setting via third-party systems according to DIN 60970-5-4
Energy management
- Identify savings potentials
- Active energy class 0.2S#
- Compliance with regulatory and tax requirements
- Configurable screened average value
Memory
- High memory depth with low memory requirements
- Storage depth up to 15 years with 23 measured values of 15 min. each and 8 measured values of 1 h each
- Memory partitioning into long-term memory and high-resolution PQ shortterm memory
Modularity
- Temperature measurement with monitoring via integrated comparator
- Ethernet interface and Modbus gateway
- Multifunction inputs for residual current measurement or DC power measurement
- Neutral conductor measurement (I4 – current measurement)
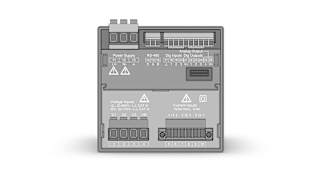
Peripherals
- 3 digital outputs
- 1 analog output
- 3 digital inputs
Communication
- Modbus Client/Server gateway functionality
- Gateway function
- Ethernet interface
- RS485
- 5 simultaneous Modbus TCP connections
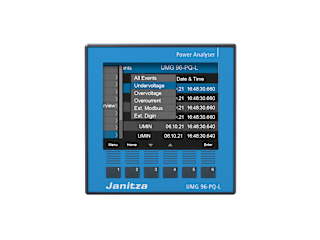
Operation
- 6-button operation on the color graphic display
- Intuitive operation
- Configuration directly on the display
- On-site and remote operation with GridVis®
- Configurable home screen and jump-back point
Comparator
- 50 comparators in the device
- Hysteresis
- Predefined comparator profiles for quick configuration (GridVis®)
Class S
- Flicker
- Interharmonics
- Standard-compliant PQ data based on, e.g. EN 50160 and IEEE519
- Rapid voltage change
- Overfrequencies & underfrequencies
- Predefined recording profiles for EN 50160, IEEE519,61000-2-4, AHF and SVG
Events
- Representation in the display
- Read out last event via Modbus
- Display root-mean-square value curves in the GridVis® event browser
Web Server
- Quick overview of the most important measurement data
- Simply access it via IP address in the browser
- Responsive display for mobile devices such as smartphones